
Relative Strength Index (RSI)
A classic momentum oscillator that helps traders spot overbought and oversold conditions before price reversals unfold.
Quick-Scan Panel
| Category | MOMENTUM |
| Primary Inputs | CLOSE |
| Default Parameters | 14-period look-back |
| Strengths | IDENTIFIES EXTREMES, ADAPTS ACROSS MARKETS |
| Weaknesses | WHIPSAWS IN STRONG TRENDS, FLATLINES IN LOW VOLATILITY |
| Best Timeframes | DAILY, 4-HOUR, HOURLY |
Key Takeaways
- RSI oscillates between 0 – 100; readings above 70 often flag overbought, below 30 flag oversold.
- Divergences between RSI and price can foreshadow momentum shifts before trend reversals.
- Adjusting the look-back period makes RSI more sensitive (shorter) or more stable (longer) to recent price action.
1. Concept & Origins
Developed by J. Welles Wilder Jr. in 1978, the Relative Strength Index measures the velocity of price moves by comparing average gains to average losses over a set period. Wilder designed RSI to solve a common trader dilemma: When is a trend stretched far enough to anticipate a reversal?
2. Mathematical Intuition
RSI transforms raw price changes into a bounded 0–100 oscillator. By normalising the ratio of up-moves to down-moves, it quantitatively captures bullish or bearish momentum extremes without drifting over time.
3. Indicator Anatomy
RSI consists of a single line oscillating between 0 and 100. Key reference zones are the 30 (oversold) and 70 (overbought) levels, though many traders customise these thresholds.
4. Calculation Guide
4.1 Formula
\(\displaystyle \begin{aligned} RS &= \frac{\text{Average Gain}_{n}}{\text{Average Loss}_{n}}\\ RSI &= 100 - \frac{100}{1 + RS} \end{aligned} \)
4.2 Worked Example
Assume the last 14 sessions produced total gains of $7 (≈ 0.5 per day) and total losses of $3 (≈ 0.21 per day). Average Gain = 0.5, Average Loss = 0.21 → RS ≈ 2.38. RSI = 100 − 100 / (1 + 2.38) ≈ 70.4, signalling a potentially overbought market.
5. How to Read the Signals
5.1 Bullish
RSI crosses up through 30 or 40, or bullish divergence (price makes a lower low while RSI makes a higher low).
5.2 Bearish
RSI crosses down through 70 or 60, or bearish divergence (price prints a higher high while RSI fails to confirm).
5.3 Confirmations & Common Pitfalls
Pair RSI with volume or trend filters (e.g., 200-day SMA) to avoid counter-trend signals during strong trends. Beware of multiple false crosses when markets are range-bound with low volatility.
6. Chart & Interpretation
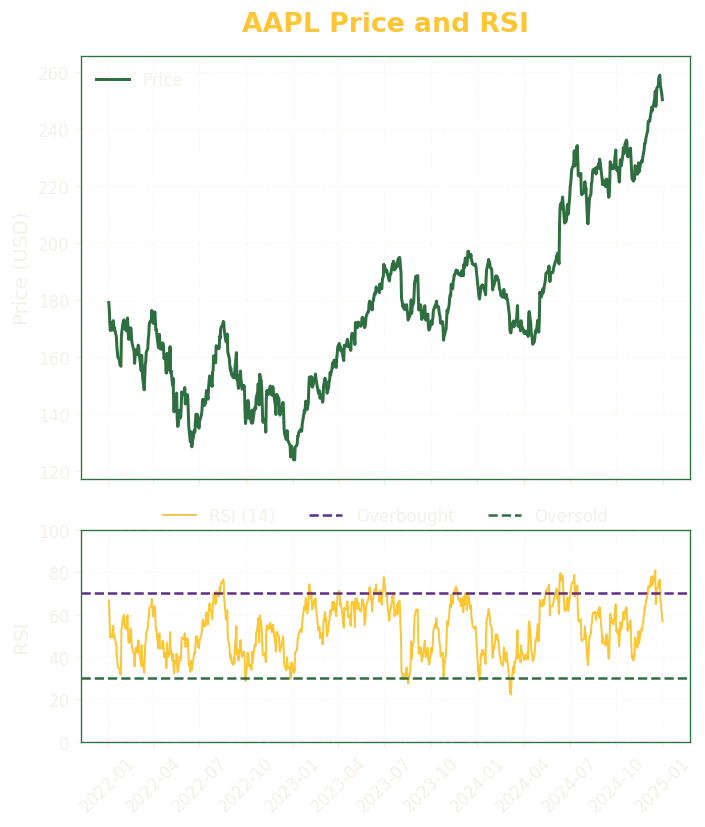
On the AAPL chart:
- Bullish signal: RSI rebounded above 30 in Jun 2022, aligning with the price bottom that month.
- Bearish signal: RSI slipped below 70 after peaking in Dec 2024, preceding a multi-week pullback.
7. Parameter Sensitivity
Shorter look-backs (e.g., 7) make RSI react faster but increase noise; longer windows (e.g., 21 or 28) smooth readings but delay signals. Traders often tighten overbought/oversold thresholds when using shorter periods to reduce whipsaws.
8. Practical Uses & Strategy Recipe
Pseudo-code Example:
If RSI(14) crosses above 30 and price is above the 200-day SMA, enter long;
exit when RSI(14) crosses below 70 or price closes below the 200-day SMA.
10. Best Practices & Limitations
9.1 Best Practices
- Use dynamic thresholds (e.g., 40/60) in strong up- or down-trends.
- Confirm RSI signals with volume spikes or candlestick patterns.
- Combine RSI divergences with support/resistance zones for higher conviction.
9.2 Limitations
- Prone to false signals during sideways consolidation.
- Overbought readings can persist for weeks in powerful bull runs.
- RSI does not quantify how far price might move—only momentum extremes.
10. Related Indicators
- Simple Moving Average (SMA)
- Exponential Moving Average (EMA)
- Moving Average Convergence Divergence (MACD)
- Stochastic Oscillator
- Stochastic RSI
11. Further Reading & References
- Wilder, J. W. New Concepts in Technical Trading Systems
- Murphy, J. J. Technical Analysis of the Financial Markets
- Internal Tinker Tailored deep dive: “RSI vs Stochastic Oscillator – Momentum Exhaustion Analysis.”