
Exponential Moving Average (EMA)
A faster-moving cousin of the SMA, the EMA helps traders stay on the right side of momentum by weighting today’s price action more heavily than yesterday’s.
Quick-Scan Panel
| Category | TREND |
| Primary Inputs | CLOSE |
| Default Parameters | 20-period smoothing (α ≈ 0.095) |
| Strengths | MORE RESPONSIVE THAN SMA, SIMPLE TO CODE |
| Weaknesses | SENSITIVE TO SHORT-TERM NOISE, LAGS AT REVERSALS |
| Best Timeframes | DAILY, HOURLY, & INTRADAY (5-MIN+) |
Key Takeaways
- The EMA reacts faster to new information than the Simple Moving Average, making it popular for momentum filters.
- Short-length EMAs (e.g., 8–21) excel at spotting early trend shifts but can whipsaw in consolidation.
- Pairing two EMAs (e.g., 20/50) creates classic crossover systems that define regime changes with transparent rules.
1. Concept & Origins
The Exponential Moving Average is a smoothed average that exponentially decreases the weight of older prices. Unlike the equal-weight SMA first documented by early Dow Theorists, the EMA emerged in the 1960s out of digital signal-processing research, then migrated into trading thanks to Welles Wilder and Gerald Appel. The goal: capture trend direction without the sluggish lag that plagues simple averages.
2. Mathematical Intuition
By assigning a fixed percentage of emphasis to today’s close (α) and letting the remaining weight decay geometrically, the EMA forms an elegant infinite impulse response filter. The curve hugs recent action yet retains enough history to smooth random spikes, striking a balance between reactivity and noise reduction.
3. Indicator Anatomy
The EMA consists of a single line that plots the exponentially weighted average of price. Its slope gauges trend strength: rising = bullish momentum; falling = bearish momentum; flat = consolidation.
4. Calculation Guide
4.1 Formula
\( \text{EMA}_t = \alpha \cdot P_t + (1-\alpha)\,\text{EMA}_{t-1}, \quad \alpha = \frac{2}{N+1} \)
4.2 Worked Example
With a 20-period EMA (N = 20), α ≈ 0.095:
- Day 0 seed: use the 20-day SMA = \$150.00.
- Day 1 close = \$151.50 → EMA₁ = 0.095 × 151.50 + 0.905 × 150.00 ≈ \$150.14.
- Repeat daily, each time nudging the average 9.5 % toward the newest close.
5. How to Read the Signals
5.1 Bullish
- Price crosses above the EMA (momentum shift).
- Fast EMA (20) crosses above slow EMA (50) — a “Golden Cross.”
- EMA slope turns upward after a basing period.
5.2 Bearish
- Price closes below the EMA.
- Fast EMA drops beneath slow EMA — a “Death Cross.”
- EMA slope rolls over from up to down.
5.3 Confirmations & Common Pitfalls
- Confirm with volume or a momentum oscillator (e.g., RSI) to filter false breaks.
- Avoid trading every minor crossover during tight sideways ranges; widen lookback or wait for range breakout.
6. Chart & Interpretation
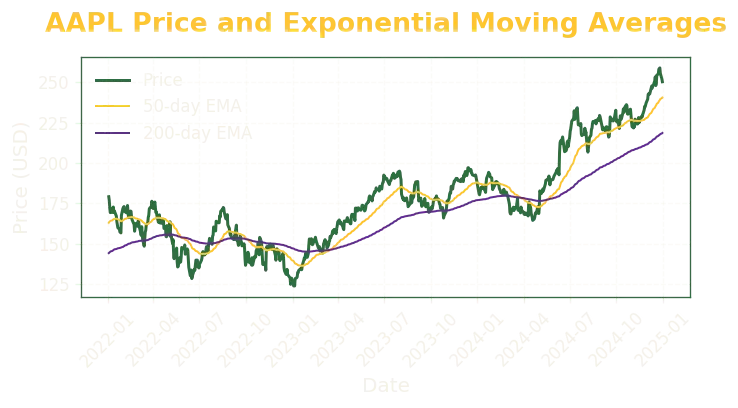
On the AAPL daily chart:
- Bullish signal » Price closed above the 50-EMA in March 2023, swiftly followed by a 20/50 Golden Cross that preceded a multi-month rally.
- Bearish signal » A 20/50 Death Cross in December 2024 aligned with a break beneath support, warning of downside risk.
7. Parameter Sensitivity
Shorter lengths (N < 15) tighten α, producing faster turns but more noise. Lengthening past 50 slows reaction, filtering chop yet increasing lag. Test values on your market: growth stocks often respond well to 10–21 EMAs, whereas indices favour 50- or 100-day smoothing.
8. Practical Uses & Strategy Recipe
Pseudo-code Example:
If Close > EMA(50) and EMA(20) > EMA(50), enter LONG;
exit when either condition reverses. Trades are evaluated on daily closes.
9. Best Practices & Limitations
9.1 Best Practices
- Combine EMAs with support/resistance for confluence.
- Use ATR or volatility filters to skip low-range days.
- Back-test multiple lengths to match asset personality.
9.2 Limitations
- Lags at major turning points — price must reverse before the EMA can.
- Prone to whipsaws during sideways markets.
- Parameter over-optimization can curve-fit past noise.
10. Related Indicators
- Simple Moving Average (SMA)
- Weighted Moving Average (WMA)
- Double Exponential Moving Average (DEMA)
11. Further Reading & References
- Murphy, J. J. Technical Analysis of the Financial Markets
- Appel, G. Technical Analysis: Power Tools for Active Investors
- Internal Tinker Tailored deep dive: “Exponential Moving Average vs SMA – Responsiveness Study.”