
Moving Average Convergence Divergence (MACD)
A momentum powerhouse that distills two exponential moving averages into one clear signal of trend strength and potential reversals.
Quick-Scan Panel
| Category | MOMENTUM / TREND |
| Primary Inputs | CLOSE |
| Default Parameters | 12-period EMA, 26-period EMA, 9-period Signal |
| Strengths | RESPONSIVE TO MOMENTUM SHIFTS, MINIMAL PARAMETERS |
| Weaknesses | LAGS IN SIDEWAYS MARKETS, DOUBLE-SMOOTHED |
| Best Timeframes | DAILY, WEEKLY, 4-HOUR |
Key Takeaways
- Combines two EMAs to reveal momentum shifts earlier than moving averages alone.
- Histogram visualises the distance between MACD and Signal lines, making divergence easy to spot.
- Crossovers work best when confirmed by volume or higher-timeframe trend direction.
1. Concept & Origins
Developed by Gerald Appel in the late 1970s, the MACD tackles a classic trader dilemma: how to spot momentum changes before the crowd without succumbing to whipsaws. By measuring the spread between a fast and a slow Exponential Moving Average (EMA), then smoothing that spread with yet another EMA, MACD offers a compact, visual readout of acceleration and deceleration in price.
2. Mathematical Intuition
Think of price like a car on the highway. The 12-period EMA tracks near-term speed, while the 26-period EMA tracks cruising speed. Subtracting the two tells us whether the car is speeding up or slowing down. Smoothing that difference with a 9-period EMA (the Signal line) removes noisy lane changes, letting you focus on sustained acceleration.
3. Indicator Anatomy
Three elements, one story:
- MACD Line – the difference between the 12- and 26-period EMAs.
- Signal Line – 9-period EMA of the MACD Line, acting as a trigger.
- Histogram – bars showing MACD minus Signal; positive when bullish momentum dominates, negative when bearish.
4. Calculation Guide
4.1 Formula
\(\text{MACD}_t = \text{EMA}_{12}(P_t) - \text{EMA}_{26}(P_t)\)
\(\text{Signal}_t = \text{EMA}_{9}\!\bigl(\text{MACD}_t\bigr)\)
\(\text{Histogram}_t = \text{MACD}_t - \text{Signal}_t\)
4.2 Worked Example
Suppose AAPL closes at \$165 on day t. After updating the 12- and 26-period EMAs, their values are \$164.20 and \$160.10 respectively.
- MACD Line = 164.20 − 160.10 = 4.10
- Update the 9-period EMA of the MACD Line to get a Signal value of 3.85
- Histogram = 4.10 − 3.85 = 0.25 (bullish momentum)
5. How to Read the Signals
5.1 Bullish
- MACD crosses above the Signal line.
- Histogram flips from negative to positive.
- Bullish divergence: price sets a lower low while MACD forms a higher low.
5.2 Bearish
- MACD crosses below the Signal line.
- Histogram flips from positive to negative.
- Bearish divergence: price sets a higher high while MACD forms a lower high.
5.3 Confirmations & Common Pitfalls
- Confirm with volume or higher-timeframe trend to reduce false signals.
- Avoid trading every crossover in choppy, range-bound markets.
- Beware of late entries when histogram bars contract after an extended move.
6. Chart & Interpretation
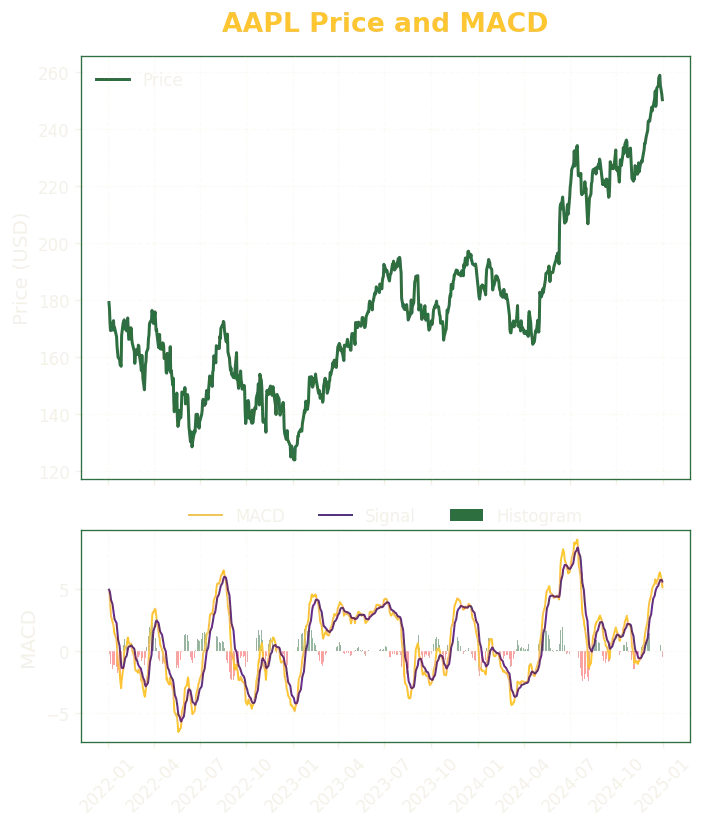
In the chart above, notice the bullish MACD crossover in January 2023, where the MACD line pierced above the Signal line and the histogram turned positive—shortly before AAPL embarked on a multi-month rally. Conversely, a bearish crossover in August 2023 saw the histogram dive below zero, foreshadowing a corrective pullback. Observing the size of histogram bars helps gauge the momentum behind each move.
7. Parameter Sensitivity
Shortening the fast EMA (e.g., 8 vs 12) makes MACD more agile but increases whipsaws. Lengthening the Signal line EMA (e.g., 9 → 12) filters noise yet delays entries. Traders often experiment with 5-34-5 or 8-17-9 settings for shorter-term trading.
8. Practical Uses & Strategy Recipe
Pseudo-code Example:
If MACD crosses above its Signal line and price is above the 200-day SMA, enter long;
exit when either condition reverses. Trades are evaluated on daily closes.
9. Best Practices & Limitations
9.1 Best Practices
- Combine MACD with support-resistance or volume for confirmation.
- Use higher-timeframe MACD to filter lower-timeframe signals.
- Watch for divergences to spot early reversals.
9.2 Limitations
- Double EMA smoothing introduces lag, especially in fast markets.
- Prone to false signals during low-volatility consolidation.
- Histogram extremes do not guarantee immediate reversals.
10. Related Indicators
- Exponential Moving Average (EMA)
- Simple Moving Average (SMA)
- Percentage Price Oscillator (PPO)
- Percentage Volume Oscillator (PVO)
- Detrended Price Oscillator (DPO)
- Awesome Oscillator (AO)
- Relative Strength Index (RSI)
- TRIX Oscillator
11. Further Reading & References
- Appel, G. Technical Analysis: Power Tools for Active Investors
- Murphy, J. J. Technical Analysis of the Financial Markets
- Internal Tinker Tailored deep dive: “MACD vs EMA – Signal Lag Analysis.”