
Average Directional Index (ADX)
The ADX distills pure trend strength into a single line, helping traders separate meaningful moves from market noise.
Quick-Scan Panel
| Category | TREND |
| Primary Inputs | HIGH-LOW-CLOSE |
| Default Parameters | 14-period smoothing (Wilder’s method) |
| Strengths | Quantifies trend strength, works across assets, filters false breakouts |
| Weaknesses | Lags due to smoothing, offers no directional bias, whipsaws in ranges |
| Best Timeframes | Daily, 4-hour, Weekly |
Key Takeaways
- ADX > 25 signals a trend worth trading; ADX < 20 warns of choppy conditions.
- The DI+ and DI- lines reveal trend direction; the ADX line measures its power.
- Rising ADX after a breakout often precedes the fastest price acceleration.
1. Concept & Origins
Created by J. Welles Wilder Jr. in New Concepts in Technical Trading Systems (1978), the Average Directional Index was designed to answer a deceptively simple question: “Is the market trending strongly enough to trade?” By transforming raw price ranges into directional movement (+DI, −DI) and then averaging their relative dominance, Wilder produced a scale from 0 to 100 that quantifies trend strength regardless of direction.
2. Mathematical Intuition
The ADX starts by comparing today’s up-move and down-move against yesterday’s. Whichever side wins contributes to the corresponding Directional Movement (+DM or −DM). Dividing each by the True Range normalizes these values into Directional Indicators (+DI, −DI). Finally, the absolute gap between those indicators—smoothed with Wilder’s exponential technique—becomes the ADX line. Because the absolute gap is used, ADX rises on both bullish and bearish trends, falling only when markets drift sideways.
3. Indicator Anatomy
ADX Line — measures trend strength on a 0–100 scale.
+DI Line — tracks positive directional movement; bullish dominance when above −DI.
−DI Line — tracks negative directional movement; bearish dominance when above +DI.
4. Calculation Guide
4.1 Formula
\( \begin{aligned} \text{DM}^+_t &= \max\!\bigl(0,\;H_t - H_{t-1}\bigr) \\ \text{DM}^-_t &= \max\!\bigl(0,\;L_{t-1} - L_t\bigr) \\ \text{TR}_t &= \max\!\bigl(H_t-L_t,\;|H_t-C_{t-1}|,\;|L_t-C_{t-1}|\bigr) \\ \text{DI}^\pm_t &= 100 \times \frac{\text{Smoothed DM}^\pm_t}{\text{Smoothed TR}_t} \\ \text{DX}_t &= 100 \times \frac{|\text{DI}^+_t - \text{DI}^-_t|}{\text{DI}^+_t + \text{DI}^-_t} \\ \text{ADX}_t &= \text{WilderEMAs}_{14}\bigl(\text{DX}\bigr) \end{aligned} \)
4.2 Worked Example
Suppose AAPL’s 14-day smoothed TR is \$4.20 and smoothed +DM is \$1.05 while smoothed −DM is \$0.70. The +DI equals (1.05 / 4.20) × 100 ≈ 25 and −DI equals (0.70 / 4.20) × 100 ≈ 17. The day’s DX becomes 100 × |25 − 17| / (25 + 17) ≈ 19. Feeding this into Wilder’s EMA stream updates the ADX; if the prior ADX was 22, the new value nudges to roughly 21—signalling a weakening trend.
5. How to Read the Signals
5.1 Bullish
+DI crossing above −DI while ADX rises above 20–25 implies a strengthening uptrend.
5.2 Bearish
−DI crossing above +DI with rising ADX highlights an intensifying downtrend.
5.3 Confirmations & Common Pitfalls
- Combine ADX with a moving-average trend filter to avoid late entries.
- A falling ADX (< 20) warns that breakout signals are prone to failure.
- Do not interpret low ADX as bearish— it merely flags “no trend.”
6. Chart & Interpretation
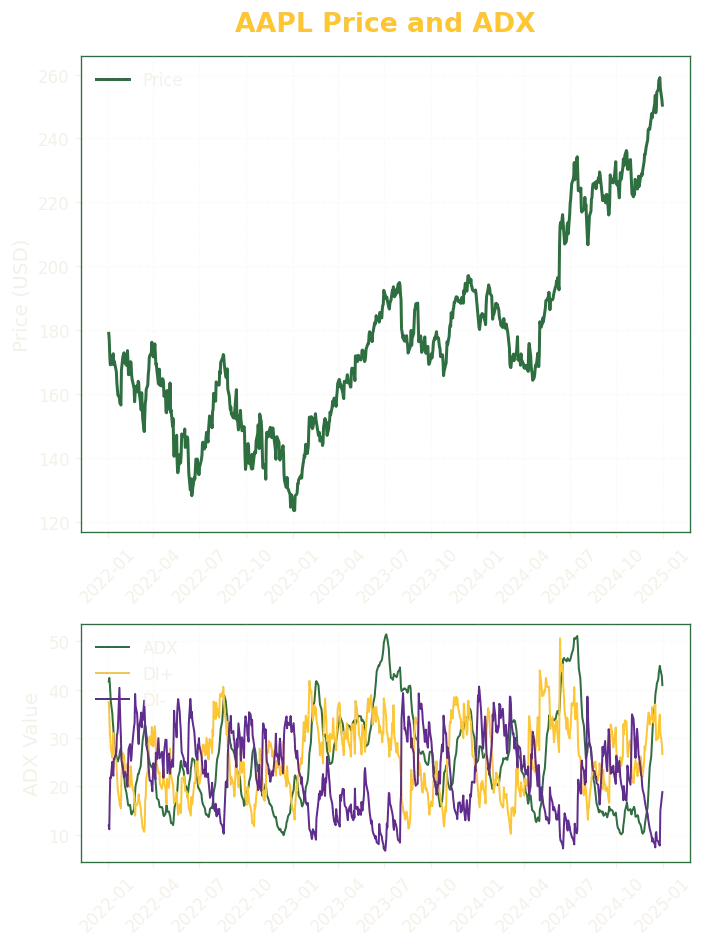
Golden Signal (Jul 2023): +DI crossed above −DI and the ADX vaulted above 25, confirming the start of AAPL’s summer rally.
Trend Exhaustion (Dec 2024): ADX peaked near 40 and rolled over while −DI crept higher—an early warning that the bullish momentum was fading and a bearish rotation could follow.
7. Parameter Sensitivity
Shorter look-backs (e.g., 7) make ADX quicker but noisier, often peaking earlier in the trend. Longer settings (e.g., 20 or 21) smooth whipsaws yet delay signals. Traders can visualise this by plotting multiple ADX lengths; notice how the 7-period line spikes sooner, whereas the 20-period line lags but sustains high values during persistent trends.
8. Practical Uses & Strategy Recipe
Pseudo-code Example:
If ADX > 25 and DI+ > DI-, enter LONG.
If ADX > 25 and DI- > DI+, enter SHORT.
Exit when ADX < 20 or the opposite DI crossover occurs. Trades are evaluated on daily closes.
9. Best Practices & Limitations
9.1 Best Practices
- Seek rising ADX values before deploying breakout strategies.
- Use a secondary filter (e.g., 200-day SMA) to align with broader trend direction.
- Pair ADX with volatility stops such as Parabolic SAR for exit timing.
9.2 Limitations
- Lag can erode early gains in fast reversals.
- Flat markets generate conflicting DI crosses—reduce position size or stand aside.
- ADX alone cannot forecast when a non-trending market will break out.
10. Related Indicators
11. Further Reading & References
- Wilder, J. W. Jr. New Concepts in Technical Trading Systems (1978)
- Murphy, J. J. Technical Analysis of the Financial Markets
- Internal Tinker Tailored deep dive: “ADX vs ATR – Measuring Trend Strength vs Volatility.”