
Parabolic Stop and Reverse (PSAR)
A dynamic trailing-stop that flips position when momentum shifts, helping traders ride trends while capping risk.
Quick-Scan Panel
| Category | TREND |
| Primary Inputs | HIGH-LOW RANGE |
| Default Parameters | Step = 0.02 • Max = 0.20 |
| Strengths | RESPONSIVE IN STRONG TRENDS, BUILT-IN TRAILING STOP |
| Weaknesses | WHIPSAWS IN CHOPPY MARKETS, PARAMETER-SENSITIVE |
| Best Timeframes | DAILY, 4-HOUR, HOURLY |
Key Takeaways
- PSAR dots switch below price in up-trends and above price in down-trends, flagging potential reversals.
- The acceleration factor (
Step) grows each time a new extreme point is set, making the stop tighten as trends mature.- Best deployed with a confirmation tool—e.g. EMA—to avoid false flips in sideways markets.
1. Concept & Origins
The Parabolic Stop and Reverse, created by J. Welles Wilder in 1978, plots a curved (parabolic) series of dots that trail price at an accelerating rate. When price touches the dots, the indicator reverses to the opposite side—hence “Stop and Reverse.” It solves two trading problems at once: capturing large trend moves and providing a mechanical exit that locks in gains.
2. Mathematical Intuition
Think of PSAR as a self-tightening leash. Early in a trend, the leash is long, giving price room to breathe. Each new extreme (highest high or lowest low) pulls the anchor forward and shortens the leash by increasing the acceleration factor. Eventually price outruns the leash; when it tags the PSAR level, the indicator flips direction, signalling that the prior trend has likely ended.
3. Indicator Anatomy
PSAR has one plotted element—the SAR dots. Their position relative to price encodes both the stop level and the current trend bias.
4. Calculation Guide
4.1 Formula
\(SAR_t = SAR_{t-1} + \alpha \bigl(EP_{t-1} - SAR_{t-1}\bigr)\)
where:
- SARt = current stop-and-reverse level
- EP = extreme point (highest high in an up-trend, lowest low in a down-trend)
- α = acceleration factor (starts at
Step, increases byStepeach time EP is updated, capped atMax)
4.2 Worked Example
Assume an emerging up-trend with Step = 0.02 and Max = 0.20:
- Day 1: SAR = prior low = 145.00. EP = current high = 147.25. α = 0.02.
- Day 2: New high 148.10 → EP updates, α rises to 0.04.
SAR = 145.00 + 0.04 × (147.25 − 145.00) = 145.09. - Day 3: Price 149.00 continues higher, α = 0.06. SAR creeps to 145.28.
- Flip: Days later, price dips to 145.30, touching SAR (145.28). The indicator switches above price, marking a stop-out and potential short entry.
5. How to Read the Signals
5.1 Bullish
- Dots flip below price → up-trend signal / long entry.
- Rising dots trail price → adjust protective stops upward.
5.2 Bearish
- Dots flip above price → down-trend signal / short entry or exit longs.
- Falling dots trail price lower → tighten stops on short positions.
5.3 Confirmations & Common Pitfalls
- Pair with ADX to confirm strong trend conditions.
- Avoid relying on PSAR alone in sideways ranges; frequent flip-flops erode capital.
- Parameter tweaks can greatly alter sensitivity—test before live use.
6. Chart & Interpretation
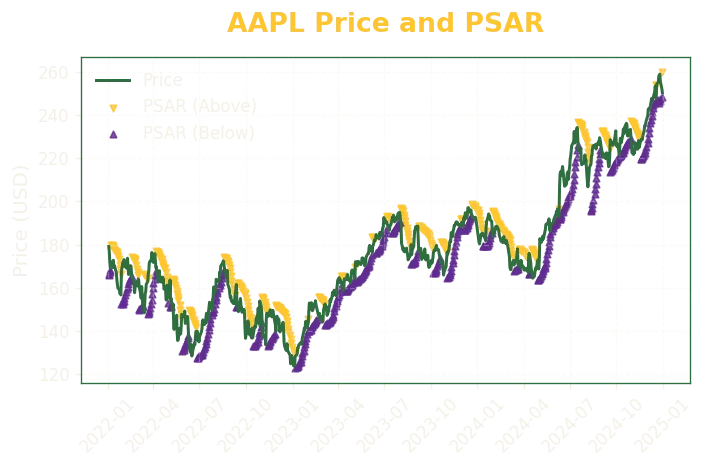
Two textbook signals stand out:
- Bullish Flip – Jul 2022: PSAR dots moved below price as AAPL broke 145 USD, signalling a new up-trend that persisted into early 2023.
- Bearish Flip – Dec 2024: Dots jumped above price near 195 USD, flagging a potential trend exhaustion and justifying profit-taking.
7. Parameter Sensitivity
Smaller Step values (e.g., 0.01) make PSAR slower but reduce whipsaws; larger values (0.03–0.04) tighten stops aggressively but risk premature reversals. The Max cap controls how close dots can get in extended trends—lowering it keeps more distance, reducing false exits.
8. Practical Uses & Strategy Recipe
Pseudo-code Example:
If Close > PSAR and 50-day SMA > 200-day SMA:
Enter LONG
Else if Close < PSAR:
Exit long or enter SHORT
Evaluate signals on daily closes; update stop to current PSAR value after each bar.
9. Best Practices & Limitations
9.1 Best Practices
- Combine with a trend confirmation tool (EMA crossover, ADX > 20) to filter noise.
- Back-test different
Step/Maxpairs on your asset universe before deployment. - Use PSAR as a trailing exit even if a different indicator handles entries.
9.2 Limitations
- High false-signal rate in low-volatility or range-bound markets.
- Parameter choice is asset-specific; no universal setting guarantees performance.
- Gap openings can leap over the PSAR level, creating slippage versus the plotted stop.
10. Related Indicators
- Exponential Moving Average (EMA)
- Average True Range (ATR) Trailing Stop
- Chandelier Exit
11. Further Reading & References
- Wilder, J. W. New Concepts in Technical Trading Systems
- Murphy, J. J. Technical Analysis of the Financial Markets
- Internal Tinker Tailored deep dive: “PSAR Parameter Tuning vs ATR Trailing Stops.”