
Volume Weighted Moving Average (VWMA)
A smart twist on the classic moving average that lets high-volume days speak louder than low-volume days.
Quick-Scan Panel
| Category | TREND |
| Primary Inputs | CLOSE + VOLUME |
| Default Parameters | 20-period window |
| Strengths | WEIGHTS PRICE BY PARTICIPATION | FILTERS LOW-VOLUME NOISE |
| Weaknesses | SENSITIVE TO VOLUME SPIKES | LAGS IN FAST MARKETS |
| Best Timeframes | DAILY | HOURLY | 15-MIN |
Key Takeaways
- VWMA tilts the moving average toward periods with heavier trading, improving trend fidelity.
- Crossovers between price and VWMA often mark shifts in supply–demand balance before a simple SMA reacts.
- Pairing VWMA with a volume-agnostic MA can reveal hidden divergences and fading momentum.
1. Concept & Origins
The Volume Weighted Moving Average answers a common trader complaint: “Why should a quiet Friday afternoon count as much as a busy earnings day?” By multiplying each closing price by its day’s volume, VWMA assigns more influence to sessions where real money changed hands. While its roots are less formally documented than the Simple Moving Average, VWMA gained traction in the 1990s among proprietary desks looking to blend price action and participation into a single trend gauge.
2. Mathematical Intuition
Think of VWMA as a weighted center of gravity for the recent price-volume cloud. Heavy-volume bars pull the average closer to their price, while thin bars barely tug. This makes the curve gravitate toward levels where conviction was strongest, filtering out low-commitment noise.
3. Indicator Anatomy
VWMA plots a single line that tracks the volume-weighted average closing price over the chosen look-back window.
4. Calculation Guide
4.1 Formula
\( \displaystyle \text{VWMA}_t = \frac{\sum_{i=0}^{n-1} P_{t-i}\,V_{t-i}} {\sum_{i=0}^{n-1} V_{t-i}} \)
4.2 Worked Example
Suppose the last five sessions closed at \$148, \$150, \$149, \$151, \$152 with volumes 2.0 M, 3.5 M, 1.2 M, 4.0 M, 3.3 M shares:
- Numerator = 148×2.0 M + 150×3.5 M + 149×1.2 M + 151×4.0 M + 152×3.3 M = 2,316 M
- Denominator = 2.0 M + 3.5 M + 1.2 M + 4.0 M + 3.3 M = 14.0 M
- VWMA = 2,316 M ÷ 14.0 M ≈ \$165.43
The average is skewed upward because higher prices coincided with heavier volume.
5. How to Read the Signals
5.1 Bullish
- Price > VWMA: Demand dominates; trend bias upward.
- VWMA Up-Slope: Sustained accumulation driving higher average cost.
5.2 Bearish
- Price < VWMA: Supply overwhelms; trend bias downward.
- VWMA Down-Slope: Distribution pushing the weighted mean lower.
5.3 Confirmations & Common Pitfalls
- Confirm crossovers with EMA or RSI to avoid whipsaws.
- Beware of single-day volume spikes (e.g., index rebalances) that can distort the curve.
6. Chart & Interpretation
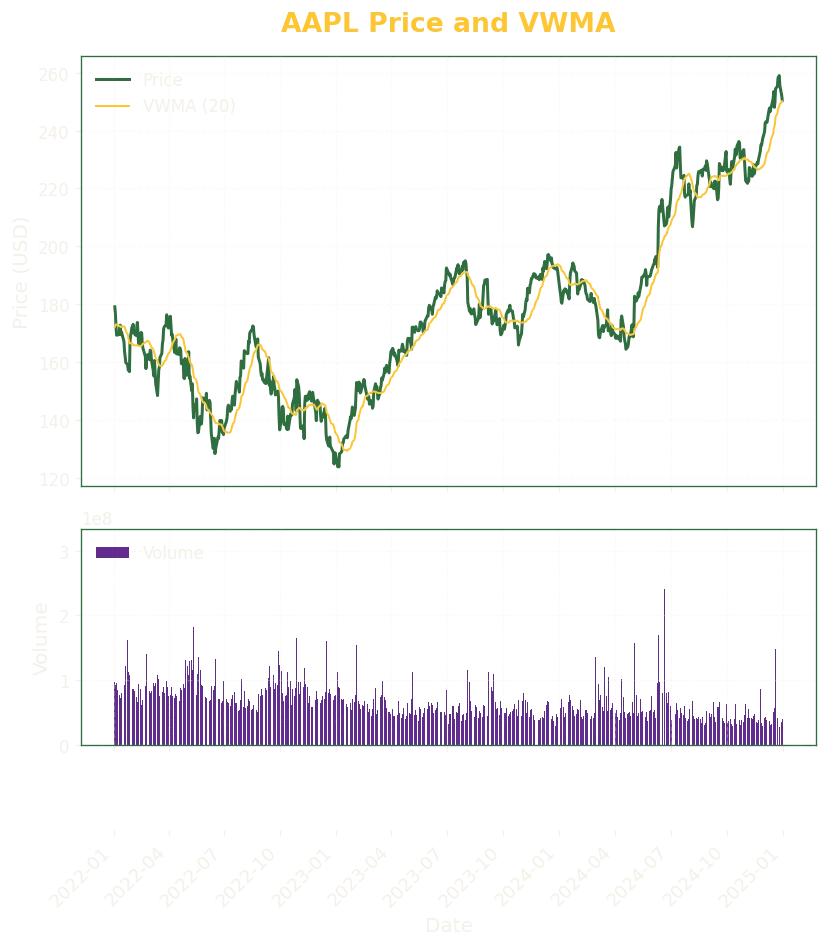
Bullish highlight — In April 2023, AAPL closed above its 20-day VWMA on expanding volume, kicking off a multi-month advance.
Bearish highlight — In September 2024, price slipped beneath the VWMA while volume surged, foreshadowing the Q4 pullback.
7. Parameter Sensitivity
Short windows (5–10 periods) hug price action but generate frequent signals. Longer windows (50–100) iron out noise yet respond slowly to fresh momentum. A dual-length approach (e.g., 20-day vs 60-day VWMA) can capture both swing and positional trends.
8. Practical Uses & Strategy Recipe
Pseudo-code Example:
If close crosses above the 20-day VWMA and volume is greater than its 50-day average,
enter LONG;
exit when close crosses below the 20-day VWMA or the 50-day VWMA turns downward.
Trades are evaluated on daily closes.
9. Best Practices & Limitations
9.1 Best Practices
- Use alongside an unweighted MA to spot volume-based divergences.
- Filter entries with an oscillator (e.g., RSI) to confirm momentum.
- Adjust the look-back period to match the asset’s average trade volume profile.
9.2 Limitations
- Extreme one-day spikes can skew the average for several periods.
- Lags during fast reversals, potentially missing sharp V-shaped bottoms.
- Less effective on illiquid assets where reported volume is unreliable.
10. Related Indicators
- Simple Moving Average (SMA)
- Exponential Moving Average (EMA)
- Weighted Moving Average (WMA)
- On-Balance Volume (OBV)
11. Further Reading & References
- Murphy, J. J. Technical Analysis of the Financial Markets
- Chande, T. “Volume-Weighted Moving Averages – A Closer Look.” Technical Analysis of Stocks & Commodities, 1994.
- Internal Tinker Tailored deep dive: “VWMA vs SMA – Volume Sensitivity Stress Test.”